matplotlib 與 seaborn 中文顯示問題
Working matplotlib and seaborn with Chinese
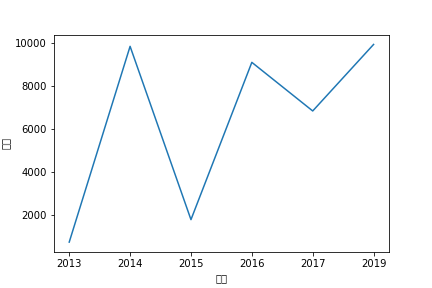
當你利用 conda 安裝好資料科學的 Python 環境(請參考 利用 conda 快速建立資料科學的 Python 環境)後,就在你想要畫出第一張折線圖(Line chart) 時,卻變成這個樣子⋯⋯

看起來很恐怖,但其實就是預設的字體裡面並沒有中文字體而已。
以下紀錄在 MacOS 上面解決的過程。
1. Find the default font of matplotlib
首先,找到我的機器目前的 matplotlib 所預設的字體是什麼以及位置
from matplotlib.font_manager import findfont, FontProperties


findfont(FontProperties(family=FontProperties().get_family()))
# output
# '/Users/Andrew/miniconda3/envs/technical-note/lib/python3.6/site-packages/matplotlib/mpl-data/fonts/ttf/DejaVuSans.ttf'
這邊顯示的是 DejaVuSans.ttf。
2. Find the path of matplotlibrc
接著,找到機器上面 matplotlibrc 的位置
import matplotlib


matplotlib.matplotlib_fname()
# output
# '/Users/Andrew/miniconda3/envs/technical-note/lib/python3.6/site-packages/matplotlib/mpl-data/matplotlibrc'
然後,用文字編輯器打開它;你可以在 Terminal 裡面執行以下程式,
open /Users/Andrew/miniconda3/envs/technical-note/lib/python3.6/site-packages/matplotlib/mpl-data/matplotlibrc
也可以在 Jupyter Notebook 裡面執行以下程式。
! open /Users/Andrew/miniconda3/envs/technical-note/lib/python3.6/site-packages/matplotlib/mpl-data/matplotlibrc
接著找到 font.family 的區塊,如下
......
#font.family         : sans-serif
#font.style          : normal
#font.variant        : normal
#font.weight         : normal
#font.stretch        : normal
## note that font.size controls default text sizes.  To configure
## special text sizes tick labels, axes, labels, title, etc, see the rc
## settings for axes and ticks. Special text sizes can be defined
## relative to font.size, using the following values: xx-small, x-small,
## small, medium, large, x-large, xx-large, larger, or smaller
#font.size           : 10.0
#font.serif          : DejaVu Serif, Bitstream Vera Serif, Computer Modern Roman, New Century Schoolbook, Century Schoolbook L, Utopia, ITC Bookman, Bookman, Nimbus Roman No9 L, Times New Roman, Times, Palatino, Charter, serif
#font.sans-serif     : DejaVu Sans, Bitstream Vera Sans, Computer Modern Sans Serif, Lucida Grande, Verdana, Geneva, Lucid, Arial, Helvetica, Avant Garde, sans-serif
#font.cursive        : Apple Chancery, Textile, Zapf Chancery, Sand, Script MT, Felipa, cursive
#font.fantasy        : Comic Sans MS, Chicago, Charcoal, ImpactWestern, Humor Sans, xkcd, fantasy
#font.monospace      : DejaVu Sans Mono, Bitstream Vera Sans Mono, Computer Modern Typewriter, Andale Mono, Nimbus Mono L, Courier New, Courier, Fixed, Terminal, monospace
......
接著,取消 font.family 與 font.sans-serif 的註解,並且在 font.sans-serif 的第一項插入我要的字體 SimHei。
......
font.family         : sans-serif
#font.style          : normal
#font.variant        : normal
#font.weight         : normal
#font.stretch        : normal
## note that font.size controls default text sizes.  To configure
## special text sizes tick labels, axes, labels, title, etc, see the rc
## settings for axes and ticks. Special text sizes can be defined
## relative to font.size, using the following values: xx-small, x-small,
## small, medium, large, x-large, xx-large, larger, or smaller
#font.size           : 10.0
#font.serif          : DejaVu Serif, Bitstream Vera Serif, Computer Modern Roman, New Century Schoolbook, Century Schoolbook L, Utopia, ITC Bookman, Bookman, Nimbus Roman No9 L, Times New Roman, Times, Palatino, Charter, serif
font.sans-serif     : SimHei, DejaVu Sans, Bitstream Vera Sans, Computer Modern Sans Serif, Lucida Grande, Verdana, Geneva, Lucid, Arial, Helvetica, Avant Garde, sans-serif
#font.cursive        : Apple Chancery, Textile, Zapf Chancery, Sand, Script MT, Felipa, cursive
#font.fantasy        : Comic Sans MS, Chicago, Charcoal, ImpactWestern, Humor Sans, xkcd, fantasy
#font.monospace      : DejaVu Sans Mono, Bitstream Vera Sans Mono, Computer Modern Typewriter, Andale Mono, Nimbus Mono L, Courier New, Courier, Fixed, Terminal, monospace
......
3. Remove the cache of matplotlib
移除 matplotlieb 的快取;你可以在 Terminal 裡面執行以下程式,
rm -rf ~/.matplotlib
也可以在 Jupyter Notebook 裡面執行以下程式。
! rm -rf ~/.matplotlib
4. Copy your font file into matplotlib
把 SimHei.ttf 字體檔放到存放字體的資料夾。
/Users/Andrew/miniconda3/envs/technical-note/lib/python3.6/site-packages/matplotlib/mpl-data/fonts/ttf
5. Restart your Jupyter Notebook
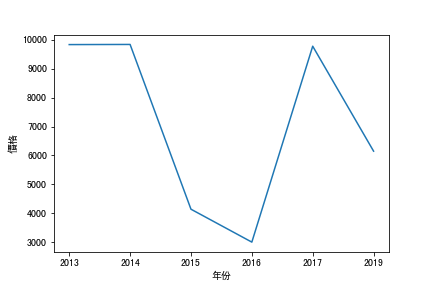
最後,重新啟動 Jupyter Notebook;再畫一次剛剛的 Line chart。

6. Customize your plot using seaborn
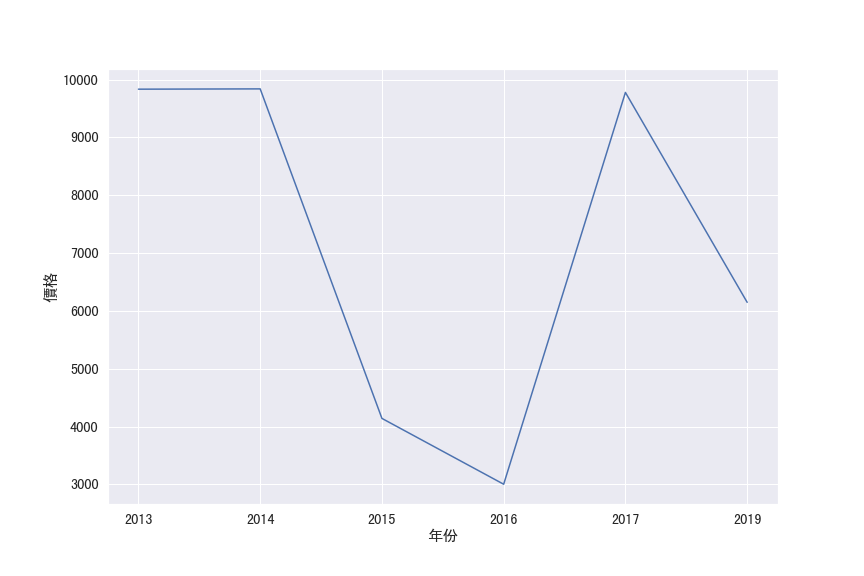
如果覺得預設的 matplotlib 畫出來不怎麼好看,像我如此沒有美感的人就會借助 seaborn 來美化我的視覺畫圖表。
import seaborn as sns


sns.set(style='darkgrid', font='SimHei', rc={'figure.figsize':(12, 8)}, font_scale=1.3)

ax = sns.lineplot(x="年份", y="價格", data=df)
 是不是好看多啦
![]()
完整的 sample code 請參考 working-matplotlib-and-seaborn-with-chinese。
Leave a comment